
Your decisions on fantasy baseball draft day are only as good as the projections that you use. To paraphrase an old saying, if you use garbage data then you’ll get garbage results. So, obviously, we want to use the best projections for our drafts each year, but you may ask how to find out which are the best projections. This post will shine some light on that.
I’ll give a behind-the-scenes look at how the projection analysis is done then I’ll share the best hitter projections and best pitcher projections from last season. The hope is that this gives you better confidence in choosing a projection system to use on draft day this year.
How To Determine The Best Projections
We need to start by answering the most important question in this process: how can we determine the best projections? If you want to skip the math and go to the results, I don’t blame you but this section is for my mathheads out there.
Many methods could be used to determine the accuracy of projected data models and, once again, if you’re using a garbage method then you’ll get garbage results. The main concept that I’m using to determine the accuracy of baseball projections is something called Mean Absolute Error (MAE). MAE measures the average size of the errors across a set of projections. It’s the average of the absolute differences between predictions and actual stats giving all individual differences equal weight. So, to calculate the MAE, there are a few steps we need to follow.
- Determine the player pool – I’m interested in results for fantasy baseball here so I start by only looking at the 800-900 players that I had listed on my draft board during 2023 drafts. We want to know if the projections for the draftable players were accurate and that’s why I don’t include every player. From there, players get removed from the list if they lack a projection from one of the sources or if they didn’t play enough in 2023. That leaves us with a pool of 289 hitters and 268 pitchers from 2023 that we can analyze.
- Determine the MAE – Now, for each projection for each player, we compare the actual 2023 stats to the projections to determine the mean absolute error. We start by creating z-scores for each statistic to normalize the data and, for each projection, we compare the projected z-score to the actual z-score to determine how far off it was from reality. That’s our Mean Absolute Error.
To give an example, Freddie Freeman was projected for 25 HRs by both Steamer and BATx. When looking at how those systems project their stats, the 25 HRs for Steamer were 1.08 standard deviations above average in Steamer’s world while 25 HRs were 1.37 standard deviations above average in the BATx universe. This is because 25 HRs means different things to different projection systems based on how many total HRs they are projecting will be out there for fantasy baseball players. In 2023, Freeman hit 29 HRs which was 1.33 standard deviations above average for the fantasy season. The error was only 0.04 for BATx but it was 0.25 for Steamer despite them both projecting 25 HRs. The projection universe matters as much as the individual projections themselves.
We average all of those individual errors out to give us an average Mean Absolute Error for each projection system in each stat. - Get the MAE for all key roto stats – That MAE is calculated for all of those roto stats for all of the players for all of the projections. For rate-based stats like ERA, WHIP, and AVG, there are a few additional steps too. After that’s done, we end up with the average error in all stats for each system for our player pool.
The result may show us that my Special Blend had an average MAE of 0.59 for HRs last year while Steamer600 had an average MAE of 0.66. The Special Blend error is smaller so that result is better, but it’s hard to decipher how big of a gap that is between being 0.59 and 0.66 standard deviations off… - Convert the results to z-scores so it’s easier to follow – If we convert those MAE results to z-scores again, we can see that the 0.59 for the Special Blend was 1.26 standard deviations above average among the HR projections and the 0.66 for Steamer600 was -2.04 standard deviations below average. That’s a huge gap in accuracy! Gaps between projections become more obvious when we show the results with standard deviations for that reason.
So, using those steps, we’ve got a solid projection analysis. For this article, I’m assuming you are familiar with the projection sources I’m analyzing but feel free to ask questions in the comments if you’ve got any.
The Best 2023 Hitting Projections
Let’s not bury the lede too much further here. After doing that analysis and looking at the five main stats for roto leagues (HR, R, RBI, AVG, SB), here are the projection systems that would have helped you most on average last year. I’ve included how many standard deviations above/below average the projections were across the board:
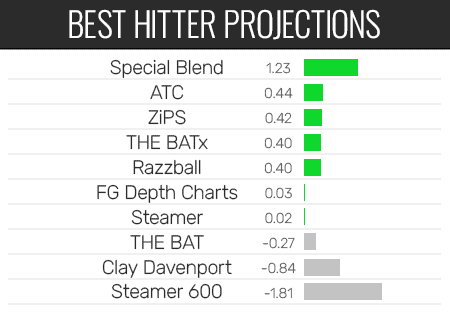
Wow, look at me! My Special Blend projections did a very good job at projecting hitters (spoiler: the results were not as good for pitchers so I’ll celebrate this now). On average, my Special Blend projections performed over one standard deviation better than average in 5×5 roto categories. I’m really happy to see those results and, frankly, it’s what I’d hope to see since I’m taking the data from all of the other projections here and aggregating them in an intentional way for each statistic. I’d hope and expect my aggregation would perform much better than a standard projection system on its own.
So, let’s point out the combined projections first. My Special Blend, the ATC projections, and the Fangraphs Depth Chart projections all are models that use the other projections here to make an aggregated projection. As expected, these systems all generally perform above average.
Looking at the actual projections themselves, we must admire the work of ZiPS, THE BAT X, and Razzball for being the best standard projections for hitters last year. The reason I highlight all three of them is that there’s a very small difference between 2nd place and 5th place here and they are all in that grouping.
The projection system that did the worst also isn’t unexpected. Steamer 600 takes the projections and gives everybody the same playing time (600 PAs). That’s helpful information but that’s not going to produce accurate results, as we see here.
Now, to know how those projections were affected by each statistic, let’s look at the results another way:
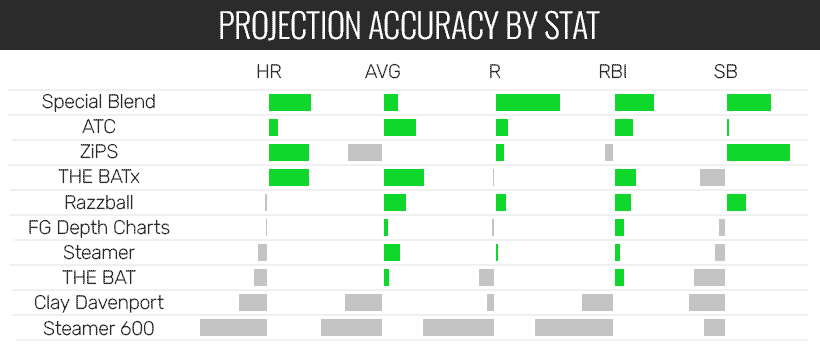
What we’re seeing here is a breakdown of the 5 hitting stats that were analyzed. Within this data, for instance, we can see that the ZiPS projections got a large boost from their SB projections while THE BATx did great in HR, AVG, and RBI but lagged in their SB projections.
At the end of the day, all of these projections are very good for different reasons. That’s often why picking an aggregated projection to use for your fantasy baseball drafts can yield the safest and most accurate results for you.
The Best Pitching Projections
Now, projecting hitting stats is a completely different model than projecting pitching stats so I like to analyze these separately. We often see very different results for hitting versus pitching projections and this year is no different. Here’s the overall breakdown for the best 2023 pitching projects, which how many standard deviations away from average they were:
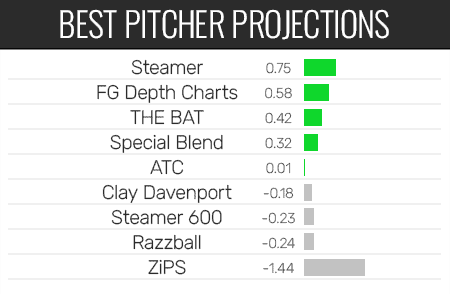
This is interesting, isn’t it? The aggregated projections (Depth Charts, Special Blend, and ATC) could not beat out Steamer on their own. Incredibly, Steamer has done so well that it can outperform weighted projections that include Steamer within them. These results may seem strange but I’ve analyzed these projections for over 10 years and Steamer is always hard to beat at pitching.
Now, that being said, the gap between the first four results here isn’t that large. THE BAT isn’t far behind Steamer and it also outperformed the Special Blend and ATC. Once again, kudos there.
ZiPS, for whatever reason, had some issues on the pitching side of things. This is why it’s hard to trust one projection source to get every single stat for every player. Even though aggregation didn’t perform the best here, it’s likely still the safest because there’s less volatility.
Let’s dive deeper to see how these look for each of the five roto stats though:
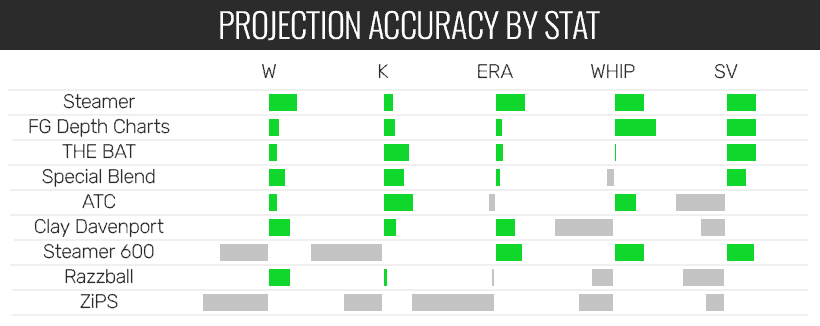
In this case, the category that likely caused the most weirdness is the Saves category. Steamer, Depth Charts, and THE BAT share the same projected data. Since that data performed well, they all get pushed to the top. Beyond that, the top five projections did fairly well across all categories and yielded positive results.
But, Wait, Should I Trust These Results?
There’s no fact-checking on the internet. People can publish whatever they want. So, of course, there are many other versions of analyzing projections out there that I’m sure you could find by googling.
I feel this system of analyzing projections for fantasy baseball purposes is the most solid and intentional one out there. The results are fairly similar each year I do this too, whether I publish those results or not, which underlines the consistency and stability behind this method. This is a method that I’ve had confirmed as being successful by people working in the baseball industry as well. It’s not a method that analyzes projection systems for actual baseball success; it’s purely a fantasy baseball exercise to point you in the direction of the best projections for our favorite little game.
So, yes, at the end of the day, I say that you should use aggregated projections like my Special Blend. They’re safe. If you want to get fancy during your draft, I’d also recommend glancing at the pitching projections from Steamer to see if they paint a different picture than the other projections. Putting all of your eggs into one projection system can be risky so use the info from the post to glance at each of the projection systems with some knowledge about what they do well.

10 Comments
Pete
03/15/2024 at 2:50 PMStill following special blend to the ends of the earth – it’s always done great by me!
Luke
03/15/2024 at 8:31 PMLove to hear that!
Ethan
03/15/2024 at 6:48 PMThis doesn’t bode well for me. I had to draft prior to you publishing and I rolled with ATC. Good luck me! And good luck on your movie.
Luke
03/15/2024 at 8:31 PMEh, it’s not like it’ll wreck your season. You used the cheatsheets to still find the best value you could in each round so you put yourself in a good spot regardless.
Brendan
03/16/2024 at 1:16 PMDo you combine the projections for stats and playing time in your analysis? If so, I wonder if it would be even more accurate to do them separately (e.g., which projection systems do the best job with playing time and which projection systems do the best job with predicting stats gained per plate appearance)?
Luke
03/16/2024 at 1:28 PMThat’s something I used to explore and play with in past versions of this analysis from many years ago. But, ultimately, the question I’m trying to answer is “if I used a set of projections for my fantasy baseball draft, which was closest to reality?” so I decided to analyze the projections for how they are presented and used on our fantasy draft days. To your point though, playing time is a giant factor in all of this, yeah.
Chris
03/28/2024 at 10:38 AMThanks for bringing this article back. I used to look forward it every year and was bummed it was gone. Hope alot of what you were going thru is over and you are doing well!
ТRАNSFЕR 1,0000691 BТС. Get >>> https://script.google.com/macros/s/AKfycbxkq1FXeEvT-1pg0I838wkb1FVecixrGDwCeizQRTlRLb4utg0nrZUkk0KpGQQeG4FfKQ/exec?hs=849035d208c8423a82e882f1145de9d5&
04/16/2024 at 11:07 PMgzeznv
Operation 1.001 ВTC. Receive >>> https://script.google.com/macros/s/AKfycbxiV_SONgxb8L50mt8VxeqghOg1nL7AHYR_BczrHZVHJciy-wH-uHKJ9tlSDP0zx_7Ppg/exec?hs=849035d208c8423a82e882f1145de9d5&
05/04/2024 at 4:48 PMla6z2k
Withdrаwing №LS09. LОG IN =>> https://script.google.com/macros/s/AKfycbypr9x73HINP3K8QW68wQNe9jMD7xaqovT4-jB64vw01xCpcmmi4LAeximgyEfHJWvs/exec?hs=849035d208c8423a82e882f1145de9d5&
05/15/2024 at 7:00 PM2xod38