
Your fantasy baseball draft preparation is going to only be as good as the projections that you use. You could have everything prepped out perfectly with great data everywhere but if your projections are telling you that Adam Dunn is still primed to hit 40 HR then you’re probably going to have a bad draft. Good projections create good drafts. The problem is that there are about a dozen projection systems out there these days and picking the “good one” without any research to back it up is hard. Don’t worry though; I’ve got your back.
 Each year I conduct an analysis of the projections from the previous season to see which ones performed best for fantasy baseball draft purposes. I’ve done this analysis over the past four years and Steamer has performed the best in three of those years when it comes to projecting hitter stats.
Despite there being a dozen different options out there, they each tackle this dilemma of projecting stats a little bit differently and some of those methods work better than others. In an upcoming post, I’ll go into more detail about each projection systems and what they offer but there are four main types in my mind: Age Regression systems, Comparable Player systems, Human Element systems and Combination systems. They each have their benefits and I’ve included representatives from each in our analysis of the 2015 projections. Last year was the first year I included a “Human Element” system like CBS or ESPN projections and they fared quite well actually but let’s see if that trend continues for this year.
The goal of this analysis is simply to find out which one of these systems did the best job at projecting our fantasy baseball hitters last year. I’m not worried about every single hitter in the league. I’m just worried about the ones who were relevant on draft day of last year. A big shout-out to the Baseball Projection Project for hosting some of the projections I didn’t have already. This wouldn’t be possible without that site.
The Projection Sources
There are twelve different projection sources included in this year’s analysis. Here are the competitors for this time around:
- Marcel (10th place in last year’s analysis) – This is as simple as baseball projections get. Marcel was developed by Tom Tango and it takes the past three years of player data, puts more weight on the most recent years and then regresses the results based on the player’s age.
- Steamer (5th place last year) – Steamer uses five years of player data and treats each stat differently for regression purposes so each component within their projections basically uses a different projection system. Despite a 5th place finish last year, Steamer finished 1st in 2012-2014.
- CAIRO (8th place last year) – From Replacement Level Yankees Weblog, it weights three years of stats like Marcel but then also regresses the results not only for age but regresses differently depending on which position the player plays. In addition, certain statistics are regressed differently than others.
- ZiPS (6th place last year) – Developed by Dan Szymborski, this system takes the past four years of stats for each player, weights the more recent years heavily but then takes those results to look for comparable historical players to determine the aging regression trend to apply.
- Clay Davenport (9th place last year) – This method also looks for comparable players like ZiPS but then applies playing time weights and redistributes the stats afterwards based on team projections and to mimic last year’s league totals.
- MORPS (7th place last year) – Like CAIRO, MORPS takes four years of player data for weighting and then does regression dependent on player position but also player league (AL or NL) then applies playing time projections based on current depth charts.
- Razzball (not in last year’s analysis) – These projections were downloaded from the Baseball Projection Projection under the name of Razzball (as opposed to Steamer Razzball) and I believe they are not done with any computer model but I don’t have details on this.
- ESPN (not in last year’s analysis) – These are done by ESPN staff and are not done via a scientific method like those mentioned above. The human element!
- CBS (2nd place last year) – Same as ESPN but by CBS staff in this case.
- Fangraphs Fans (4th place last year) – This is a crowdsourced projection where users of Fangraphs can project a player and this averages all of those projections.
- Fangraphs Depth Chart (not in last year’s analysis) – This is the first of our combination projections. First, it combines ZiPS and Steamer projections and then playing time is done by Fangraphs staff as opposed to letting the projections predict playing time.
- Mr. Cheatsheet’s Special Blend (1st place last year) – Like the Fangraphs Depth Chart, this combines other projections. However, each stat uses a different weighting system for the combination of projections. However, unlike Fangraphs Depth Chart, this lets the projection systems predict playing time.
The Method
First off, there’s something you need to understand with projections. If you’re using a projection system for fantasy baseball, you’re not actually too worried about whether the projections match the actual year-end totals. That sounds crazy but what you actually want is the system to be accurate in telling you how far above or below average each player is within those projections. One system might award home runs more generously than another but all you really want to know is which players have the best projected stats within those projections. That’s key to understanding how I rate projections.
With that in mind, I standardize all of the projections for each statistic to get z-scores which tell me how far above or below average each player is projected to be in that stat. At that point, I choose to use Mean Absolute Error (MAE) to compare the results. It basically averages out the difference between the projected z-score and the z-score from the actual 2015 stats among our pool of comparable players.
Comparing these projections is about comparing how much they would have helped you on draft day of last year so I only included players in this analysis that were showing up in drafts last preseason and were projected by all 12 projection systems. I also removed players who ended up not playing last season or played in an extremely limited capacity. This left me with 232 hitters to analyze projections for.
The Initial Results
I could analyze every stat in the book but I focused on the five main rotisserie categories to see how well the systems did in projecting the actual results there. These projections include the projected stats and playing time for each player. After analyzing the 12 systems in those five categories, here is how they ranked:
| HR | AVG | R | RBI | SB | Avg Rank | |
| Fangraghs – Depth Chart | 2 | 1 | 1 | 2 | 1 | 1.4 |
| Special Blend | 1 | 2 | 3 | 4 | 2 | 2.4 |
| Steamer | 5 | 3 | 4 | 1 | 3 | 3.2 |
| Fangraphs – Fans | 7 | 4 | 5 | 6 | 5 | 5.4 |
| ZiPS | 4 | 6 | 8 | 8 | 6 | 6.4 |
| Razzball | 9 | 12 | 2 | 5 | 4 | 6.4 |
| ESPN | 6 | 10 | 6 | 3 | 10 | 7.0 |
| CAIRO | 3 | 9 | 9 | 12 | 8 | 8.2 |
| Clay Davenport | 12 | 8 | 7 | 9 | 7 | 8.6 |
| CBS | 8 | 11 | 7 | 9 | 8.8 | |
| MORPS | 10 | 5 | 10 | 10 | 11 | 9.2 |
| Marcels | 11 | 7 | 11 | 11 | 12 | 10.4 |
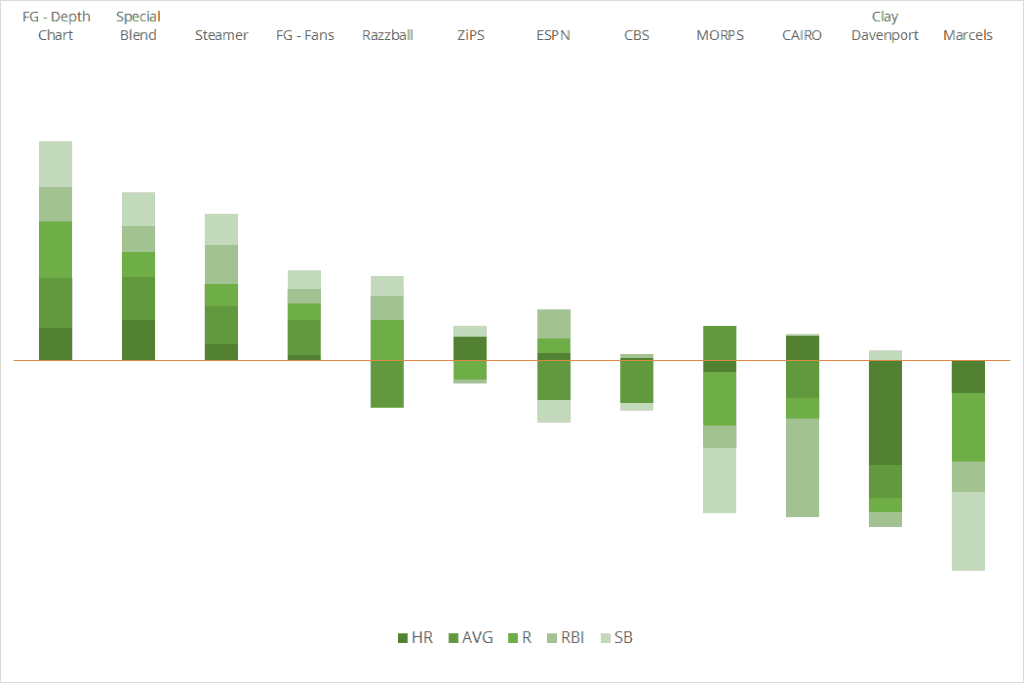
The two projections that combine other projections finished first here but Fangraphs beat our my projections and that’s likely because of their method of projecting playing time by hand. Ignoring the combined projections, Steamer finishes way ahead of the others so regains its crown as the best projection system here. Fangraphs also did well with their Fan projections as they finished above other human-entered systems like CBS and ESPN. ZiPS also had a strong showing while the Age Regression systems of CAIRO, MORPS and Marcels struggled a bit here.
To see just how well each system performed in those categories, this chart breaks down their performance and how far above or below average it was in each category:
The Results With Playing Time Excluded
What we’ve seen so far demonstrates who had the best combination of projecting stats and projecting the correct amount of playing time for players. It’s not easy for a computer to project playing time based on past data though! So, how would the systems fare if we took playing time out of it? Well, let’s see. I looked at the projections in the same manner but compared them based on each stat projected per at-bat (I’d prefer to use plate appearance but not every system projected that stat). Doing the analysis that way changes things up from our initial results a bit. Here is what we get:
| HR | AVG | R | RBI | SB | Avg Rank | Change from Initial | |
| Fangraghs – Depth Chart | 2 | 2 | 2 | 1 | 3 | 2.0 | -0.6 |
| Special Blend | 3 | 1 | 5 | 3 | 4 | 3.2 | -0.8 |
| Steamer | 9 | 3 | 8 | 4 | 1 | 5.0 | -1.8 |
| ZiPS | 1 | 6 | 7 | 5 | 8 | 5.4 | +1.0 |
| ESPN | 4 | 10 | 4 | 2 | 10 | 6.0 | +1.0 |
| Marcels | 6 | 7 | 1 | 7 | 11 | 6.4 | +4.0 |
| CBS | 11 | 8 | 6 | 2 | 6.8 | +2.0 | |
| MORPS | 8 | 5 | 3 | 8 | 12 | 7.2 | +2.0 |
| CAIRO | 5 | 11 | 6 | 12 | 5 | 7.8 | +0.4 |
| Fangraphs – Fans | 7 | 4 | 9 | 10 | 9 | 7.8 | -2.4 |
| Clay | 12 | 9 | 10 | 11 | 6 | 9.6 | -1.0 |
| Razzball | 10 | 12 | 11 | 9 | 7 | 9.8 | -3.4 |
The Fangraphs Fan projections and Razzball projection took a big hit which means that they likely had accurate playing time projections boosting their initial rankings. One of the big draws of the Fan projections is that you have real people projecting playing time so the projections are a bit less accurate without that.
Meanwhile, the combined projections still did just fine without playing time anyway. Some of the age regression systems, like Marcels, got a nice boost when playing time wasn’t a factor in the projection. Steamer continued to do just fine even without playing time included here.
Conclusions
This isn’t exactly news if you read this column each year but we can draw two big conclusions here:
- Accurate playing time projections matter
- Combining other projection systems is a good thing to do
When it comes to playing time, the systems that incorporate some sort of human element to help with projecting playing time generally fare better in initial projections. It’s just not easy for a computer system to know if a guy is projected to be a starter or not each year.
Outside of that, whenever projections get combined in some manner, it helps with the overall accuracy here. I’ve done straight-up averaging of multiple projections in the past and that works quite well even.
That being said, it wouldn’t possible to combine projections if we didn’t have some awesome projections to start with. Steamer is always a force when it comes to projecting hitters and other systems such as ZiPS and MORPS do great work each year too. It does seem like the systems that rely strictly or heavily on age regression models do struggle a bit more versus these other methods but each system has its benefits.
The Winner for the Best 2015 Fantasy Baseball Projections!
I’m not going to award the winner to one of the combined systems because they wouldn’t exist without the work of the projections that go into them. When it comes to projecting hitters, Steamer simply did it best in 2015 whether playing time was included or not so kudos to Jared Cross and his team for another successful run of the Steamer projections. This is the fourth time they’ve taken my crown in the past five years here which makes them officially a dynasty when it comes to hitter projections.


Evo34
03/09/2016 at 11:54 PMLove this. Any chance you can directly measure playing time forecast accuracy? It seems like Steamer (or maybe even Razzball?) is prob. the best at that, but would be interesting to know.
Travis
03/10/2016 at 9:25 AMI only found your site mid-season last year, but do you plan on doing the same comp for pitchers?
And question, under ‘The Projection Sources’ you have CBS ranked as finishing 2nd in 2015; but by the chart they are 3rd from the bottom. Am I missing something?
Luke
03/10/2016 at 1:06 PMI’ll be publishing the pitcher comparison today or tomorrow and then, finally, I’ll publish my own projections for 2016 based on what I learned from these.
As for CBS, I should specify in the post that they finished 2nd in the 2015 version of my analysis but, then, yes did much more poorly in this year’s version. I’ll edit the post to make that more clear. Good catch!