
Many of us put a lot of blind faith into choosing a baseball projection system to help us win our fantasy leagues. My very cheatsheets here are reliant on them as you see calculated values in there based on a particular projection system. This can be dangerous because it means that poor projections could curse our entire fantasy season. That’s why I try to analyze the accuracy of the various projection systems each year to see which ones are most worth using for fantasy baseball.
I have run this little independent site for ten years now, and I’ve analyzed the projections nearly every season in that time. That being said, I didn’t analyze them last year, simply due to life getting in the way. It always seemed like Steamer was going to finish at the top anyway, I thought. They had a good run of typically being the top performer, but we’ve had new projection systems pop up during the past couple years.
It is time to do some proper analysis again to see if the projection universe has shifted.
The Projection Systems
Without getting too deep into the history of projections, they all can thank the original Marcel projections by Tom Tango where he would weight stats from the three previous seasons and adjust for regression. It was a simple system, but it sparked wonder in people and that caused many others to expand on it by adding lots of smart tweaks to that general idea over the years.
Looking back at the 2018 projections, there seem to be eleven competitors that I feel are worth taking a look at. Here’s the list of them, noting how they fared last time I did this analysis and their methodology:
- Steamer (1st in hitters & pitchers in 2017) – Steamer uses five years of player data and treats each stat differently for regression purposes so each component within their projections basically uses a different projection methodology. In the many years I’ve done this test, they’ve typically finished at the top.
- Steamer 600 (9th in hitters in 2017, 7th in pitchers) – This is a modified version of the Steamer projection where it eliminates playing time projection and assumes every projected hitter will have the same PA (600) and every pitcher will have the same IP. It’s not really met for this type of testing as the playing time will obviously be way off, but it’s fun to include for reference.
- CAIRO (5th in hitters in 2017, 9th in pitchers) – From Replacement Level Yankees Weblog, it weights three years of stats but then also regresses the results not only for age but regresses differently depending on which position the player plays. In addition, certain statistics are regressed differently than others.
- ZiPS (3rd in hitters in 2017, 5th in pitchers) – Developed by Dan Szymborski, this system takes the past four years of stats for each player, weights the more recent years heavily but then takes those results to look for comparable historical players to determine the aging regression trend to apply.
- Clay Davenport (6th in hitters in 2017, 4th in pitchers) – This method also looks for comparable players like ZiPS but then applies playing time weights and redistributes the stats afterwards based on team projections and to mimic last year’s league totals.
- Fangraphs Fans (7th in hitters in 2017, 6th in pitchers) – This is a crowd-sourced projection where readers at Fangraphs can project a player on the site, and this averages all of those projections for that player.
- Fangraphs Depth Chart (4th in hitters in 2017, 3rd in pitchers) – This is a combination of projections. First, it combines ZiPS and Steamer projections, but then playing time is adjusted by the humans on Fangraphs staff as opposed to letting the projections blindly project playing time.
- Mr. Cheatsheet’s Special Blend (2nd in hitters & pitchers in 2017) –I started doing these in 2013. Like the Fangraphs Depth Chart, these combine other projections. However, each individual stat uses a different weighting system for that combination of projections. Based off my historical research, I may know that one system is much better with HR’s so I give them additional weight over other projections.
- ATC (not used in 2017) – On the surface, the idea behind ATC seems fairly identical to my Special Blend approach. They take different projection sources and past stats, then weight them differently for each category based on their research. I guess it means that there’s validity to such a process! This is my first time including them in this analysis and I’ll be curious to see how their weights match up versus mine.
- THE BAT (not used in 2017) – Developed by Derek Carty and, like Steamer and ZiPS, this system uses regression and aging curves but it has unique twists like factoring in umpires, weather and platoon splits. This is likely due to the fact that it was originally designed for DFS play. This is my first year including it, so we’ll see how it stacks up to the other regression-focused models.
- Pod (not used in 2017) – Mike Podhorzer has been doing projections since 2001. He incorporates xStats into his analysis, but also touts his manual approach of accounting for things like injuries, mechanical changes and more. I can’t determine the exact methodology but it seems to be a delicate balance of science and human touch. This is also the first time I’ve included them in this test.
The Method
Two of the better tools for measuring prediction accuracy are Mean Absolute Error (MAE) and Root Mean Squared Error (RMSE). They both are statistics that are designed to measure the magnitude of errors in a sample of predictions. While I calculate both in my testing, I’ve settled on MAE being the better tool for this test because it doesn’t penalize large errors as heavily as RMSE.
It should be noted for this test that I’m not actually trying to see how a projection compared to the actual results in a given year. Each projection system operates within its own baselines and that’s important to consider. If Steamer thinks the average fantasy hitter in their universe will hit 20 HRs then a hitter hitting 25 HRs is a notch above average. During the actual season, we may find the average fantasy hitter only hit 15 HRs, so a hitter getting 25 HRs would be significantly above average. To account for these different baselines, I test how far above/below average a player’s projection was within each fantasy stat compared to how far above/below average they actually finished the season.
In order to do such a thing, I calculate averages and standard deviations for each projection universe and convert each statistic to z-scores. I then use the Mean Absolute Error to compare those projected z-scores to the actual z-scores from the season. This is done with the typical 5×5 roto stats for both pitching and hitting, while taking into account playing time adjustments for rate-based stats like AVG, ERA and WHIP.
This analysis is specifically for fantasy baseball draft purposes so I start with the list of players that were being drafted in fantasy drafts last preseason. I accumulate all of the projections for them and their actual stats from last year. I eliminate players that didn’t have a projection across the board, or those that didn’t play enough in the actual season to be analyzed. This typically leaves us with about 200 hitters and 100 pitchers to calculate the MAE for each projection.
The Hitter Results
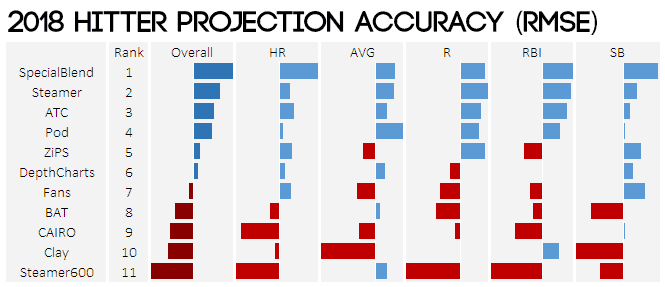
When analyzing the fantasy hitter projections from last year, I look at the main 5×5 roto stats of HR, AVG, R, RBI and SB. In the many years of doing this test, Steamer has typically been top dog. My Special Blend of projections have often offered an improvement over Steamer but not always. In the 2017 analysis, Steamer even outpaced the combined projection systems. With so many new competitors in the mix, I was actually somewhat surprised at the results.

My Special Blend projections were able to surpass the competition here, partially aided by a strong showing in the HR category. I should note that the top four projections were all a significant step above the rest, but fairly close to each other. For instance, when running this analysis using RMSE instead of MAE, the order of the top four changed slightly, yet they were all still in their own tier.
The Pod projections are one of the few paid systems out there, and this shows why. They’re right up there with Steamer and the combined projection systems like Special Blend and ATC. That’s an impressive showing. As for the rest, the classic regression-based models like CAIRO have seemingly been surpassed by the newer approaches of Steamer and others. Steamer600 is there to remind us all that projecting playing time accurately is important as well.
The Pitcher Results
Just like with the hitters, I’m looking at the main roto 5×5 categories when it comes to pitching too. However, I choose to leave out Saves in the analysis. Some systems don’t project Saves (like ZiPS) and real-life managers have way too much control over that stat for me to fault a projection system for projecting that inaccurately.
Steamer has also historically been the best when it has come to projecting pitchers over the years in these tests. In fact, they’ve historically outperformed the combined systems like Special Blend and Depth Charts. It’s a new season of analysis with new competitors again though, so the results are a bit different than past years.

Once again, the Pod projections came in and stole Steamer’s glory. When it comes to non-combined projections, it seems that Pod validates itself as one of the best choices out there. Steamer, of course, is no slacker here because they were the best at projecting both rate-based stats of ERA and WHIP. After a couple off years, it appears that my tweaks have paid off because the Special Blend projections did outperform the competition in 2018 with positive showings in all stats here. I should note that I didn’t have projections for THE BAT so I couldn’t include them in the analysis.
All in all, this shows that Steamer represents a tremendous free projection system, and Pod is a really great choice if you’re willing to pay for a projection system.
Conclusions
This is the first year that I can remember doing this analysis where Steamer wasn’t #1 or #2 in my results. That’s not to say they’re still not the premier choice, because they certainly are. With a small-ish sample size of about 300 total players, a few projections being wrong in a year can shift things a bit.
One big takeaway for me from this year’s analysis is that the Pod projections are pretty damn strong and worthy of their reputation. However, selfishly, I am happy to see my Special Blend system return to top of both charts. You can remain confident in using Steamer or my Special Blend projections within your cheatsheets here (or however you choose to use them).


Tim Curtis
03/09/2019 at 1:41 PMHi Luke. Do you have an ETA on when you are going to release your special blend projections?
Luke Gloeckner
03/09/2019 at 2:18 PMWorking on them now. They should be up on the site by tomorrow morning. I’ll probably also post an early link to the Google Sheet on Twitter tonight before I have the article up.
Luke Gloeckner
03/10/2019 at 12:11 AMActually, nevermind what I said earlier. I’m running out of time tonight to finish them up but I will have them up at some point tomorrow after I finish all of the number-crunching!
Mike
03/10/2019 at 9:27 PMHi Luke, thank you for all of this it is awesome! Are your projections up and will they load into your cheatsheet?
Luke Gloeckner
03/13/2019 at 4:14 PMProjections are now up and loaded into version 1.60 of the cheatsheets.
Effem
03/09/2019 at 2:53 PMHave you run the numbers without using playing time estimates (HR/PA, etc)?
Curious George
03/10/2019 at 1:24 PMWhat is the difference between special blend and special blend with steamer replacements?
peter
03/12/2019 at 5:12 PMIf I remember correctly, Special Blend with Steamer Replacements means that for any player, their projection will typically be their Special Blend projection, but in those cases where there is no Special Blend projection, you can expect the Steamer projection instead.
Mark
03/10/2019 at 6:41 PMAre you using the actual special blend you created in 2018 or a theoretical “optimized” blend had you known how 2018 played out?
Luke Gloeckner
03/13/2019 at 4:13 PMI used my version from 2018 to see how well it did.
RickM
03/14/2019 at 3:01 PMHi,
What are you showing in the bar charts for hitting and pitching stats? I realize blue =good and red = bad, but what are the numbers?
John
03/19/2019 at 12:01 PMResults seem different compared to the fantasypros study.
https://www.fantasypros.com/2019/03/most-accurate-fantasy-baseball-projections-2018/
Don
03/24/2019 at 2:07 PMThis is always my favorite post of the year. Thanks & congrats, Luke! Question: is Depth Chart PT worth anything? If your Special Blend were adjusted to Depth Chart PA/IP, would they be improved?
Thanks for all your work.